How ASPM Works
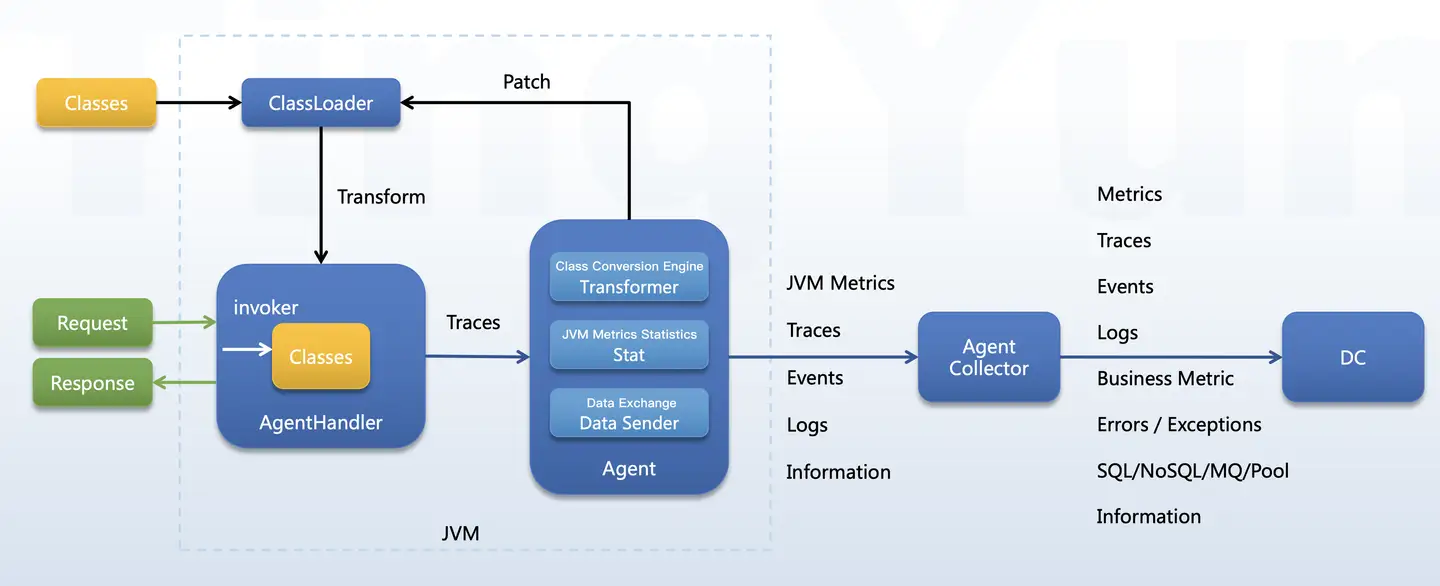
The Agent adopts a two-tier architecture, including the Agent component running on monitored applications and the Collector component running on independent servers. The Agent component is responsible for code instrumentation and raw data collection of applications. All collected information is transmitted directly to the Collector via local area network, where the Collector performs data statistics and correlation, and ultimately reports to the platform's data center.
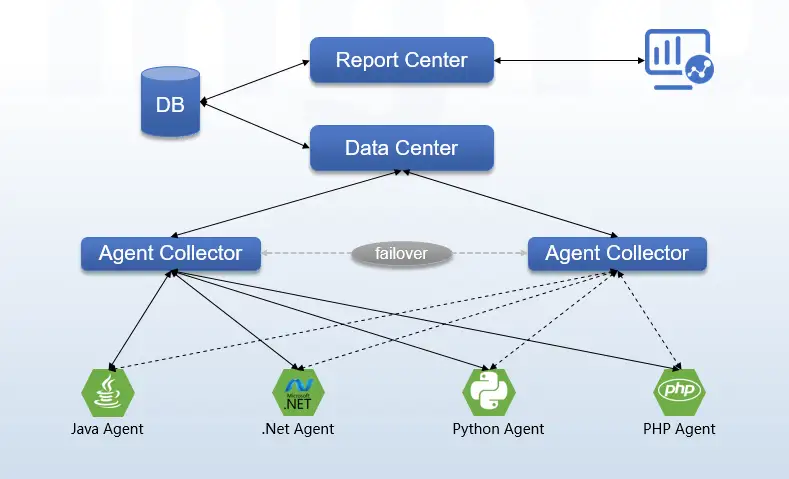
Since the Agent collects full business, performance, and security data and transmits it to the Collector in real-time, there must be a smooth local gigabit network connection between the Agent and Collector. The Collector supports high availability with Failover. Multiple Collector servers can be deployed for a group of Agents. When individual servers fail and cannot work normally, the Agent can transmit data to other Collectors in real-time through the Failover mechanism to achieve high availability of data collection. The Collector's high availability mechanism is shown in the following figure:
Java Agent utilizes the Instrumentation mechanism of the JDK to dynamically monitor key methods of components such as framework, database, NoSQL, Web service through bytecode operations during application runtime. By collecting performance metrics such as method execution time, database call time, NoSQL response time, and external service response time in real-time, the system automatically performs call stack analysis when these metrics detect abnormal invocations or exceed security thresholds. This process identifies potential security threats, such as dangerous method executions or anomalous database calls, enabling real-time detection and blocking of potential attacks. This provides comprehensive runtime protection for applications, effectively enhancing their security and stability.