Troubleshooting
Agent Installed Successfully, But No Monitoring Data in the Console?
Normally, after your application receives requests, you should see data in the console within about 5 minutes. If there is no data, it may be due to the following reasons:
-
Agent Over Limit
How to check: In the left navigation bar, click Management > Configuration > Agent Management > Agent Management to view the Agent running status. Solution: Disable Agents for applications you are not currently monitoring, or purchase more Agents.
-
No Data Access
Solution: Access the application with the embedded Agent multiple times, then wait about 1 minute and check the page again.
-
Inconsistent Time or Time Zone Between Servers
Solution: Correct the time on the server where the Agent is installed to match the DC time; for SaaS users, update the server time to the current time.
-
Configuration Error
Solution: Confirm whether the values of license_key and collector.addresses in tingyun.properties are complete or contain extra characters.
-
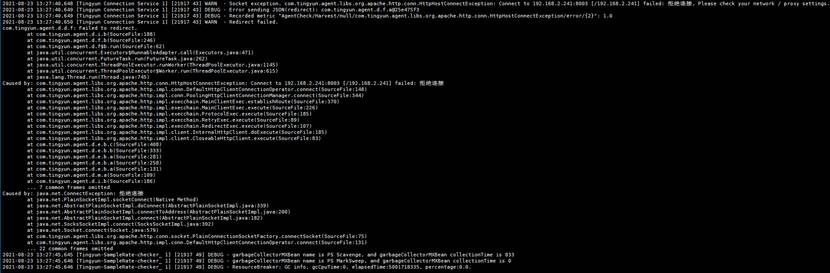
Network Unreachable
How to check: Check /path/to/tingyun/logs/tingyun_agent.log
Example:
Solution: Check the network status and ensure the port is accessible.
-
Tomcat Has No temp Directory, Causing Agent Startup Failure
Symptom: After Tomcat loads the Agent and starts, no tingyun_agent.log is generated in /path/to/tingyun/logs/.
Solution: Create a temp directory in the Tomcat root directory.
Application Fails to Start After Installing the Agent?
- Issue 1:
Error in the log:
Error opening zip file or JAR manifest missing : /home/apache-tomcat-8.0.36/tingyunn/tingyun-agent-java.jar

Error occurred during initialization of VM

agent library failed to init: instrument
Cause:
The specified path to tingyun-agent-java.jar is incorrect or the file is incomplete, causing startup failure.
Solution:
Correct the absolute path of the Agent or check the Agent's md5 to ensure the integrity after extraction.
- Issue 2:
Error in the log:
Exception in thread "main" java.lang.OutOfMemoryError: GC overhead limit exceeded

Exception in thread "Tingyun Agent Shutdown" java.lang.OutOfMemoryError: GC overhead limit exceeded
Cause:
Insufficient memory.
Solution:
Increase the memory limit. For specific values, contact technical support.
- Issue 3:
Error in the log:
java.lang.VerifyError:null
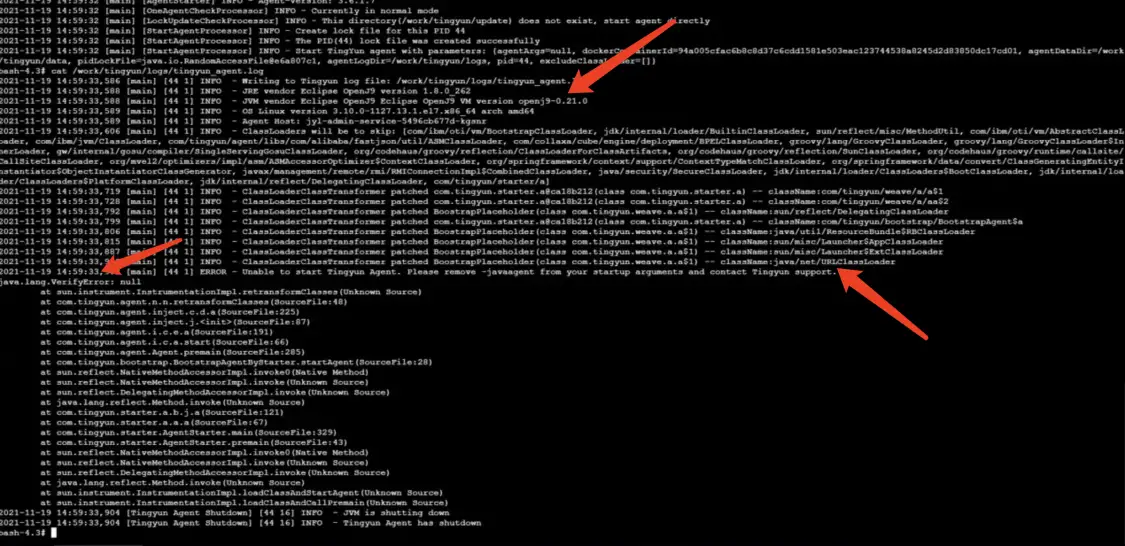
Cause:
The direct cause is that after instrumenting java/net/URLClassLoader, verification fails. The root cause is that the customer is using OpenJ9 JDK.
Solution:
Agent configuration:
class_transformer.classloader_delegation_excludes=java/net/URLClassLoader
No logs Directory Generated After Installing the Agent
Symptom: After deploying the Java Agent, running ps -ef | grep tingyun shows a tingyun application process, but no logs directory is generated under the tingyun directory.
Causes:
Possible reasons include:
-
There are other vendors' Agents. You can check with
ps -ef | grep agent. If so, run the uninstall command in the competitor's directory. Usingkillallto kill the competitor's process is ineffective. -
The tingyun directory does not have sufficient permissions; at least 755 permissions are required.
chmod -R 755 ./tingyun -
The application name in tingyun.properties is all digits (cannot start with a digit); there is garbled text in tingyun.properties; or there are typos, e.g., true written as ture, false as flase.
No Data in Database Connection Pool, How to Solve?
-
Confirm whether the database connection pool version is supported. See the Support List for details.
-
Confirm whether the JDBC URL of the database is supported. Please consult Tingyun TAM for details.
-
There is database connection pool data in the console transaction trace details, but no data in the connection pool.
Cause: The registration information of the database connection pool failed to be written to the database. The Agent only reports the registration information once.
Solution: Restart the Agent.
-
No access to the database connection pool.
Solution: Access the interface that calls the database connection pool multiple times, wait 1-2 minutes, and check the connection pool data again.
How to Shorten Application Startup Time After Loading the Agent?
Symptom: After loading the Agent, the application startup time is tens of seconds or minutes longer than without the Agent.
Solution:
-
After loading the Agent for the first time, check the application in the report. The default business system for the application is default.
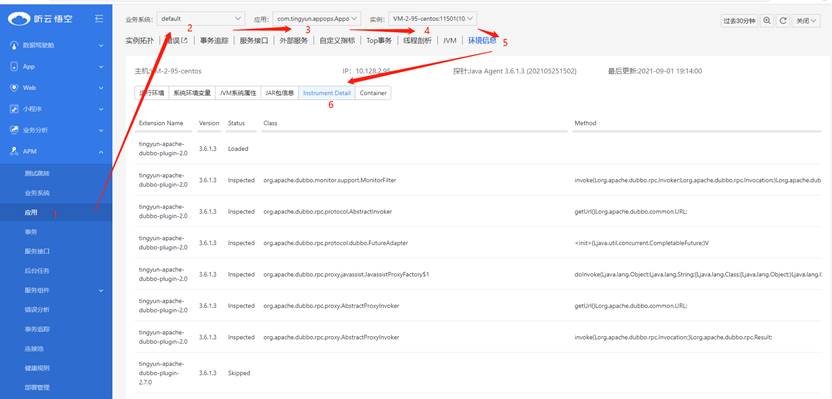
-
In the left navigation bar, select Application & Microservice > Application, select the business system default → select the corresponding application → select the corresponding instance → select the Environment Information tab → select Instrument Detail.
-
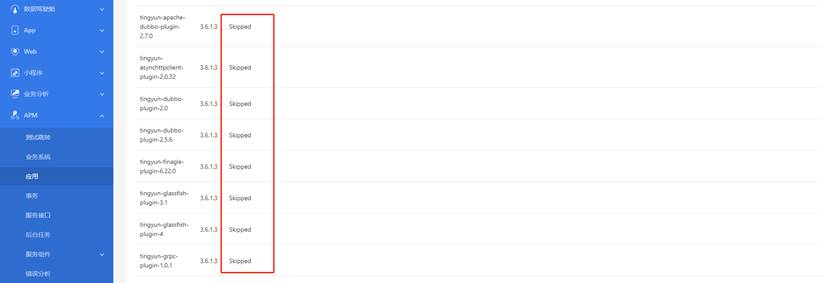
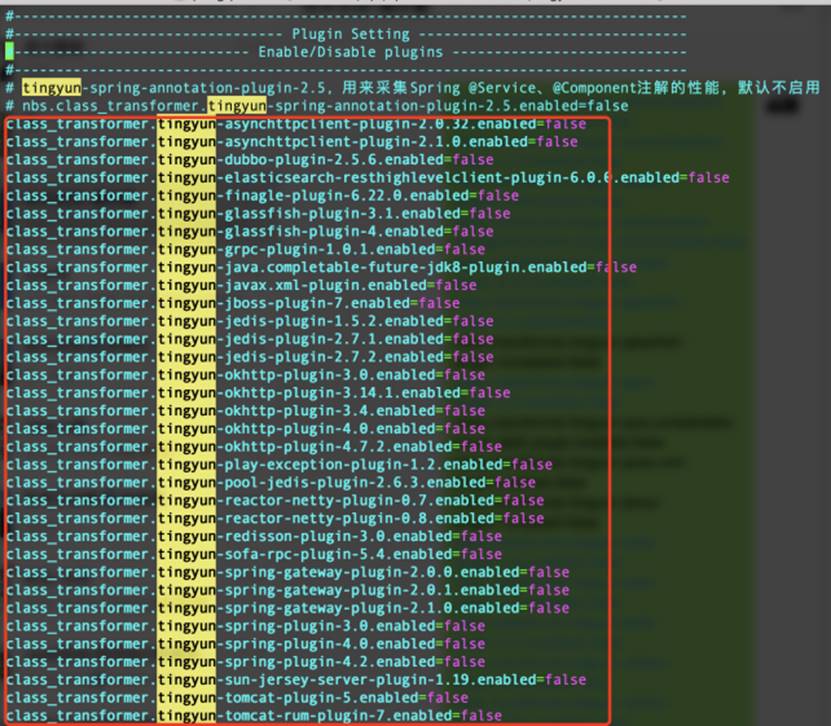
Check the Status of the Agent plugins, and disable all plugins except Inspected.
-
In the Agent configuration file tingyun.properties, add the Extension Name to be skipped. On the next Agent startup, these plugins will not be loaded. The rule is
class_transformer.<component_name>.enabled=false. -
After configuration, save and restart the application.
What to Do If Application Memory Usage Surges After Agent Runs?
When you find memory overflow or long-term high memory usage, analyze the cause by dumping memory.
- Dump the memory usage of the process to a file.
jmap -dump:format=b,file=wx.hprof <pid>
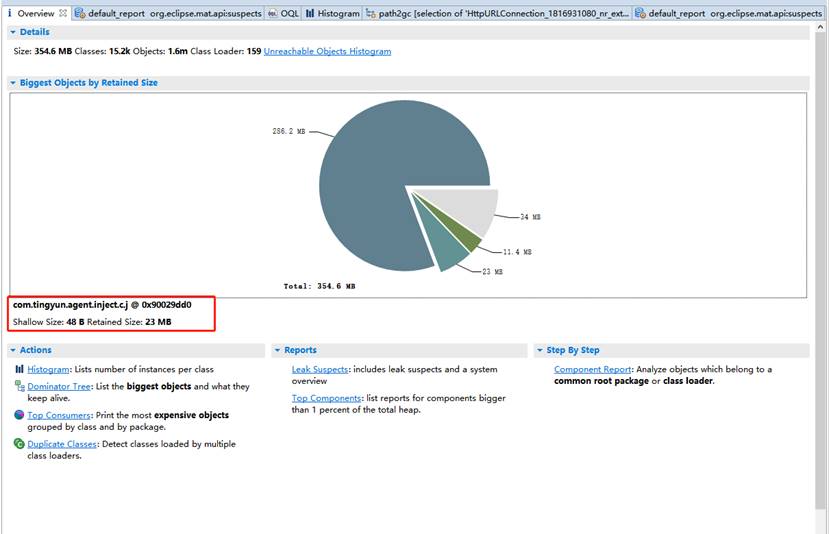
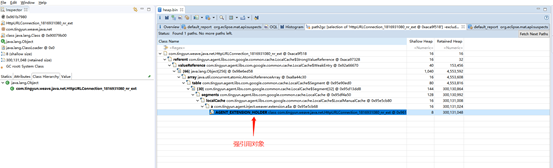
- Use mat to open the dump file.
-
If com.tingyun.agent.inject.c.j exceeds 200M, the Agent is likely problematic.
-
If tingyun objects account for more than 20%, the Agent is likely problematic.
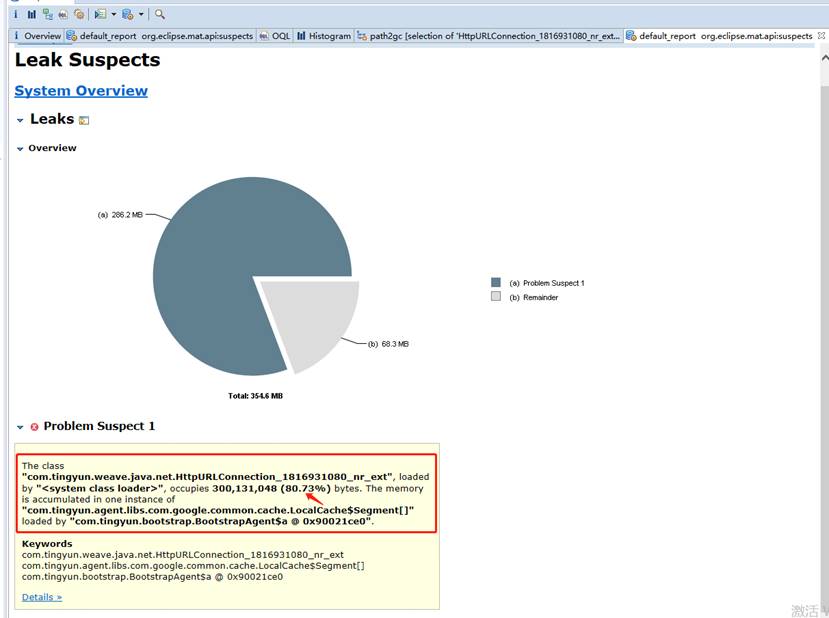
- Find the reference object. Right-click and select Path To GC Roots > exclude all plantom/weak/soft etc. References.
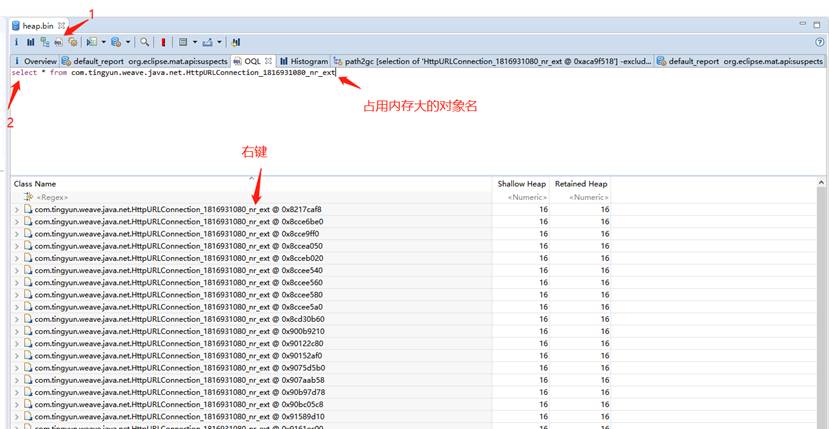
Explanation: exclude all plantom/weak/soft etc. References: excludes phantom, weak, and soft references, leaving only strong references. From the GC perspective, except for strong references, other references can be GC'd by the JVM when needed. If an object cannot be GC'd, it is because of strong references, leading to memory leaks.
Find the strong reference object and have R&D analyze it.
What to Do If Report Data Is Inaccurate After Agent Runs?
-
The error count of business system/application/transaction is inconsistent with the error count in error analysis.
Cause: The error count in error analysis is the transaction error count. Check whether there are service interfaces with errors.
-
In the error analysis page, the error count in the transaction error trend is inconsistent with the data in the transaction error list.
Cause: The two charts query different tables. Data inconsistency may be caused by inconsistent entry times.
-
In the error analysis page, the error count in the transaction error type breakdown is inconsistent with the data in the transaction error list.
Cause:
- The transaction error list is limited to 1000 transactions.
- The transaction error list filters out data with action_id = 0.
-
The data in the new and old versions of error analysis is inconsistent.
Cause: The logic of the new and old versions of error analysis is different. The new version does not count errors/exceptions that occur in background tasks.
-
In the error analysis page, the error trace list has no data.
Cause:
- Elasticsearch write or query error.
- Exception Messages contain special characters, resulting in no matching data (resolved in V3.6.2.0).
-
Database has error counts, but the error list shows no data.
Cause: The error count counts all errors that occurred in the component, but the error list only shows Database Exception type errors.
-
The number of exceptions in the trace details is inconsistent with the data in the exceptions tab.
Cause: The exception count is for entry transactions/service interfaces, while the exceptions tab shows exceptions for entry and downstream calls.
-
App/Web jumps to the trace details in Application & Microservice and prompts "No data found or more than one result".
Cause:
- No trace data in the query time range.
- Multiple data entries with the same trace_guid.
-
In the transaction list, there are transactions under a single application, but searching for "All" applications cannot find the transaction.
Cause: The transaction list is limited to 500 records sorted by response time in descending order. The transaction is outside the 500 records, so it cannot be found.
-
The customer business has a connection pool, but the report trace details do not show connection pool data.
Cause: The registration information of the connection pool was not uploaded.
-
When configuring data items, the corresponding class information cannot be found.
Cause: The class information was not written to the database, or the write failed.
-
The transaction trace list has data, but entering the trace details prompts no data found or an error.